")
")
Cart is empty
Are you interested in our products? Consult our specialists
MASHGEO LLC has developed a highly efficient, high-performance and low-cost technology for processing organic waste (sewage sludge, chicken, pig manure, cattle manure, alcohol and sugar production waste, lignosulfanates, etc.), peat and sapropel into complex humic fertilizers.
The developed technology and equipment make it possible to design (create) highly effective complex fertilizers for specified types of soils in accordance with their agrochemical analysis and for specified types of cultivated crops (seeAppendix 1 ).
Advantages of produced humic fertilizers:
Fertilizers can be produced in the form of a paste-like concentrate and in the form of granules. They are not susceptible to overdose, increase the activity of the plant cell, contain a special composition of trace elements, increase the frost resistance of plants, eliminate phenolic intoxication of the soil and convert nitrates into safe nitro compounds.
At the same time, the developed technology makes it possible to give fertilizers additional other useful properties.
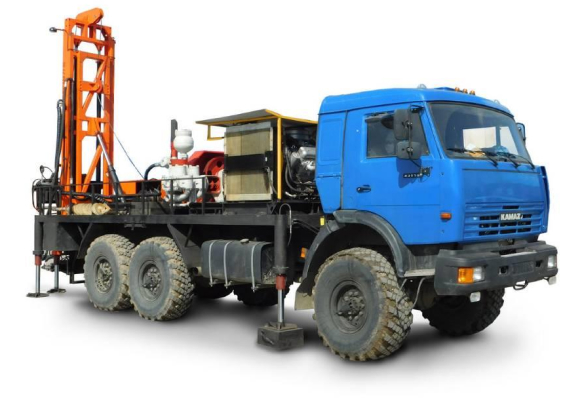
The equipment for processing organic waste into complex humic fertilizers consists of two main blocks.
In the first block, organic waste is decontaminated by destroying pathogenic microflora, helminths, viruses, etc., destruction of antibiotics, activation of fulvic acids and humic acids.
In the second block, the fertilizer is constructed by mechanochemical activation, the absorption of heavy metals by humic acids with the formation of water-insoluble (chelated) humic compounds.
The equipment occupies a small area, can have a mobile design, is easily scaled and can be produced with a capacity of 2,5,10,15 and 20 tons of fertilizers per hour.
Appendix 1
|
|
|
Alluvial turf soils |
|
|
Alluvial soils |
|
|
Anthropogenic soils |
|
|
Sod-podzolic soils |
|
|
Turf soils |
|
|
Yellowlands |
|
|
Chestnut soils |
|
|
Brown soils |
|
|
Carbonate soils |
|
|
Krasnozems |
|
|
Meadow-chernozem soils |
|
|
Podzolic soils |
|
|
Serozem |
|
|
Grey forest soils |
|
|
Weakly podzolic soils |
|
|
Malt |
|
|
Solontsy |
|
|
Terra Rosa |
|
|
Chernozems |
|
|
|
|
Appendix 2
|
No. in order |
The name of the defined product indicators |
Units of measure |
Actual value |
The method used |
|
1 |
Mass fraction of dry substances |
grams per litre |
7,2-9,2 |
In weight |
|
2 |
Mass fraction of organic matter per dry product, not less than |
% |
40,0-50,0 |
In weight |
|
3 |
Indicator of the activity of hydrogen ions of salt extraction |
pH |
8,9 |
potentiometry |
|
4 |
Mass fraction of calcium, in terms of CaO |
grams per litre |
0,02 |
titrometry |
|
5 |
Mass fraction of magnesium, in terms of MgO |
grams per litre |
0.0005 or more |
titrometry |
|
6 |
Mass fraction of total nitrogen per dry substance |
grams per litre |
2.5 and more at least 2.5 |
Kjeldahl 's method |
|
7 |
Mass fraction of phosphorus in terms of P2O5 per dry substance |
grams per litre |
2 or more at least 2.0 |
photometry |
|
8 |
Mass fraction of total potassium in terms of K2O |
grams per litre |
1.56-2.5 and more |
ionometry |
|
9 |
Mass fraction of nitrate nitrogen |
mg/l |
850,0-950.0 and more |
ionometry |
|
No. in order |
The name of the defined product indicators |
Units of measure |
Actual value |
The method used |
|
1 |
Mass fraction of moisture, min |
% |
70 |
In weight |
|
2 |
Mass fraction of organic matter per dry product, not less than |
% |
54,6 or more |
In weight |
|
3 |
Indicator of the activity of hydrogen ions of salt extraction |
pH |
8,0 |
potentiometry |
|
4 |
Mass fraction of calcium, in terms of CaO |
% |
3,08 |
titrometry |
|
5 |
Mass fraction of magnesium, in terms of MgO |
% |
0,52 or more |
titrometry |
|
6 |
Mass fraction of total nitrogen per dry substance |
% |
2,05 or more |
Kjeldahl 's method |
|
7 |
Mass fraction of phosphorus in terms of P2O5 per dry substance |
% |
1,10 or more |
photometry |
|
8 |
Mass fraction of total potassium in terms of K2O |
% |
1,1 or more |
ionometry |
|
9 |
Mass fraction of nitrate nitrogen |
mg/kg |
650,0 and more |
ionometry |
|
No. in order |
The name of the defined product indicators |
Units of measure |
Actual value |
The method used |
|
1 |
Mass fraction of moisture, min |
% |
13 |
In weight |
|
2 |
Mass fraction of organic matter per dry product, not less than |
% |
70 |
In weight |
|
3 |
Indicator of the activity of hydrogen ions of salt extraction |
pH |
7,5 |
potentiometry |
|
4 |
Mass fraction of calcium, in terms of CaO |
% |
3,5 |
titrometry |
|
5 |
Mass fraction of magnesium, in terms of MgO |
% |
0,6 |
titrometry |
|
6 |
Mass fraction of total nitrogen per dry substance |
% |
3,0 |
Kjeldahl 's method |
|
7 |
Mass fraction of phosphorus in terms of P2O5 per dry substance |
% |
2.0 and more |
photometry |
|
8 |
Mass fraction of total potassium in terms of K2O |
% |
2.0 and more |
ionometry |
|
9 |
Mass fraction of nitrate nitrogen |
mg/kg |
700 |
ionometry |
Приложение 3
|
Name of the component |
% content |
|
Complexes |
0,2 |
|
Sewage sludge* |
92,8 |
|
Peat |
7 |
*Chicken manure, cattle manure and pig manure may be added.
|
Organic fertilizers |
Dry weight (%) |
Organic substances (%) |
|
|
in a fresh mass |
In the dry mass |
||
|
Cereal straw |
86 |
82 |
95 |
|
Corn straw |
86 |
80 |
93 |
|
Green fertilizers |
15 |
14 |
81 |
|
Sugar beet tops |
15 |
13 |
77 |
|
Compost from biological waste and greenery |
50 |
20 |
40 |
|
Liquid manure |
7,5 |
4,5 |
63 |
|
Stall manure |
29 |
23 |
82 |
|
Sewage sludge, liquid |
5 |
2,3 |
46 |
|
Condensed sewage sludge |
34 |
12,5 |
37 |
Ratio C:N allows us to conclude about the content of microbiologically digestible carbon in the soil. A wide spread of C:N leads to temporary fixation of N in the soil (immobilization of N).
|
Organic fertilizers |
Content in % TM |
|||||
|
N |
Р |
К |
Са |
Mg |
S |
|
|
Cereal straw |
0,6 |
0,2 |
1,4 |
0,3 |
0,1 |
0,1 |
|
Corn straw |
1,5 |
0,2 |
2,4 |
0,4 |
0,2 |
0,1 |
|
Green fertilizers |
|
|
|
|
|
|
|
Fodder rapeseed/fodder beet |
2,7 |
0,4 |
2,6 |
1,6 |
0,2 |
0,3 |
|
Clover |
5,5 |
0,6 |
5,0 |
0,6 |
0,4 |
0,4 |
|
Sugar beet tops |
2,3 |
0,1 |
2,9 |
1,2 |
0,4 |
0,3 |
|
Compost from biological waste |
1,5 |
0,4 |
1,0 |
3,0 |
0,5 |
0,7 |
|
Compost of greenery |
1,2 |
0,2 |
0,8 |
3,7 |
0,5 |
0,6 |
|
Liquid manure (cattle) |
9,7 |
0,8 |
5,9 |
1,7 |
0,7 |
0,6 |
|
Liquid manure (pigs) |
8,7 |
2,4 |
6,3 |
3,3 |
1,2 |
0,8 |
|
Stall manure (cattle) |
2,8 |
0,9 |
2,6 |
2,2 |
0,7 |
0,5 |
|
Stall manure (pigs) |
3,0 |
2,8 |
4,6 |
3,9 |
1,5 |
0,6 |
|
Stall manure (broilers) |
4,7 |
4,7 |
2,6 |
2,4 |
0,7 |
0,6 |
|
Sewage sludge |
4,3 |
2,1 |
0,4 |
8,0 |
0,5 |
0,7 |
|
|
Dry weight in quintals/he*year |
Introduction of nutrients in kg/he*year |
|||||
|
N |
Р |
K |
Са |
Mg |
S |
||
|
Cereal straw |
70 |
42 |
14 |
98 |
21 |
7 |
7 |
|
Corn straw |
110 |
165 |
22 |
264 |
44 |
22 |
11 |
|
Green fertilizers |
|
|
|
|
|
|
|
|
55 |
149 |
22 |
143 |
88 |
11 |
17 |
|
50 |
275 |
30 |
250 |
30 |
20 |
20 |
|
Sugar beet tops |
75 |
173 |
8 |
218 |
90 |
30 |
23 |
|
Compost from biological waste |
100 |
150 |
40 |
100 |
300 |
50 |
70 |
|
Compost of greenery |
100 |
120 |
20 |
80 |
370 |
50 |
60 |
|
Liquid manure (cattle) |
10 |
97 |
8 |
59 |
17 |
7 |
6 |
|
Liquid manure (pigs) |
10 |
87 |
24 |
63 |
33 |
12 |
8 |
|
Stall manure (cattle) |
25 |
70 |
23 |
65 |
55 |
18 |
13 |
|
Stall manure (pigs) |
25 |
75 |
70 |
115 |
98 |
38 |
15 |
|
Stall manure (broilers) |
25 |
118 |
118 |
65 |
60 134 |
18 |
15 |
|
Sewage sludge |
16,7 |
72 |
35 |
7 |
134 (7-568) |
8 |
12 |
|
|
Yield in quintals/he |
Average consumption of nutrients by plants in kg/he*year |
|||||
|
Winter wheat (grain) |
80 |
160 |
28 |
40 |
4 |
10 |
9 |
|
Winter rapeseed (grain) |
35 |
116 |
27 |
29 |
4 |
11 |
14 |
|
Sugar beet |
600 |
108 |
24 |
126 |
25 |
30 |
36 |
|
|
The content of trace elements in mg/kg dry masses |
|||||
|
Fe |
Mn |
Zn |
Cu |
В |
Mo |
|
|
Cereal straw |
45 |
30 |
20 |
3 |
3 |
0,3 |
|
Corn straw |
50 |
40 |
23 |
9 |
5 |
0,5 |
|
Green fertilizers |
|
|
|
|
|
|
|
218 |
120 |
20 |
8 |
22 |
0,3 |
|
147 |
50 |
43 |
10 |
18 |
0,6 |
|
97 |
46 |
32 |
7 |
5 |
0,2 |
|
Sugar beet tops |
593 |
168 |
66 |
12 |
31 |
0,8 |
|
Compost from biological waste |
10883 |
433 |
202 |
60 |
22 |
2 |
|
Compost of greenery |
|
516 |
171 |
41 |
21 |
2 |
|
Liquid manure (cattle) |
1244 |
285 |
225 |
54 |
31 |
2 |
|
Liquid manure (pigs) |
2661 |
528 |
864 |
225 |
44 |
6 |
|
Stall manure (cattle) |
1467 |
235 |
144 |
34 |
25 |
1,3 |
|
Stall manure (pigs) |
2148 |
240 |
491 |
213 |
21 |
2 |
|
Stall manure (broilers) |
1269 |
536 |
377 |
112 |
52 |
5 |
|
Sewage sludge |
41498 |
470 |
917 1 |
328 |
39 |
6 |
|
|
Dry weight in quintals/he*year |
Introduction of nutrients in kg/he*year |
|||||
|
Fe |
Mn |
Zn |
Cu |
В |
Мо |
||
|
Cereal straw |
70 |
| 315 |
210 |
140 |
21 |
21 |
2 |
|
Corn straw |
110 |
550 |
440 |
253 |
99 |
55 |
6 |
|
Green fertilizers |
|
|
|
|
|
|
|
|
55 |
1199 |
660 |
110 |
44 |
121 |
2 |
|
50 |
735 |
250 |
215 |
50 |
90 |
3 |
|
|
485 |
230 |
160 |
35 |
25 |
1 |
|
Sugar beet tops |
75 |
4448 |
1260 |
495 |
90 |
233 |
6 |
|
Compost from biological waste |
100 |
108830 |
4330 |
2020 |
600 |
220 |
20 |
|
Compost of greenery |
100 |
119910 |
5160 |
1710 |
410 |
210 |
20 |
|
Liquid manure (cattle) |
10 |
1244 |
285 |
225 |
54 |
31 |
2 |
|
Liquid manure (pigs) |
10 |
2661 |
528 |
864 |
225 |
44 |
6 |
|
Stall manure (cattle) |
25 |
3668 |
588 |
360 |
85 |
63 |
3 |
|
Stall manure (pigs) |
25 |
5370 |
600 |
1228 |
533 |
53 |
5 |
|
Stall manure (broilers) |
25 |
3173 |
1340 |
943 |
280 |
130 |
13 |
|
Sewage sludge |
16,7 |
69302 |
785 |
1531 |
548 |
65 |
10 |
|
|
Yield in quintals/he |
Average consumption of nutrients by plants in kg/he*year |
|||||
|
Winter wheat (grain) |
80 |
138 |
144 |
179 |
34 |
58 |
3 |
|
Winter rapeseed (grain) |
35 |
188 |
102 |
108 |
13 |
70 |
12 |
|
Sugar beet |
600 |
593 |
469 |
373 |
102 |
204 |
2 |
The introduction of trace elements into the soil by organic fertilizers in comparison with the consumption of trace elements by plants